
When I completed my first economic impact study, I thought the final report would be the biggest takeaway.
I was wrong.
One of the most valuable insights came from something much simpler: mapping where our students, employees, and alumni lived.
At first, I viewed it as another step in the process. I geocoded addresses, assigned counties, and identified congressional districts because I needed the information for the study.
Then it hit me.
Our institution wasn’t just educating students.
We were serving the constituents of elected officials across the state.
That changed how I thought about institutional value.
Looking Beyond Enrollment
Most colleges describe themselves using enrollment, graduation rates, or economic impact.
Those measures are important.
But geographic analysis tells a different story.
Instead of saying:
“We enroll 3,500 students.”
You can say:
- You represent 218 of our students.
- 36 of our employees live in your district.
- More than 1,100 alumni call your district home.
- Our institution generates $24 million in economic activity that benefits your constituents.
That changes the conversation.
Instead of asking legislators to support your institution because it is important, you’re demonstrating how your institution directly benefits the people they were elected to serve.
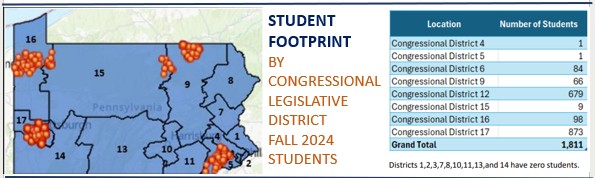
Figure 1. Example of student home addresses assigned to U.S. congressional districts using ArcGIS. Geographic analysis helps institutions identify where they have influence and communicate their impact to elected officials.
Geographic Analysis Has Many Uses
While geographic analysis is an important part of an economic impact study, its value extends much further.
It can support:
- Government relations
- State and federal funding requests
- Economic impact studies
- Enrollment planning
- Recruitment market analysis
- Alumni engagement
- Strategic planning
- Grant proposals
The same geographic analysis can support multiple institutional priorities.
Most Institutions Already Have the Data
The good news is that most colleges already collect the information needed for this type of analysis.
Student, employee, and alumni address files can be used to identify:
- Counties
- Congressional districts
- State legislative districts
- Recruitment markets
- Service areas
The challenge isn’t collecting the data.
The challenge is transforming those addresses into meaningful information that supports decision making and tells a stronger institutional story.
You Don’t Need to Be a GIS Expert
Many institutions assume they need specialized GIS software and in-house expertise to perform geographic analysis.
For many colleges, that’s simply not practical. Geographic analysis may only be needed once or twice a year, making the cost of software and training difficult to justify.
Turning Insight into Action
At Ingram Market Analytics, LLC, I help colleges and universities transform student, employee, and alumni address data into meaningful geographic insights, including county, congressional district, and state legislative district assignments.
These insights support economic impact studies, government relations, strategic planning, enrollment management, and executive reporting, without the need to purchase or learn specialized GIS software.
Whether you’re conducting your first economic impact study or simply looking at your data from a new perspective, geographic analysis can help you better understand your institution’s reach and communicate its value.
Looking at Data Differently
Sometimes the most valuable insights don’t come from collecting more data.
They come from looking at the data you already have in a different way.
Geographic analysis isn’t really about maps.
It’s about understanding where your institution has influence and using that knowledge to tell a more compelling story.
