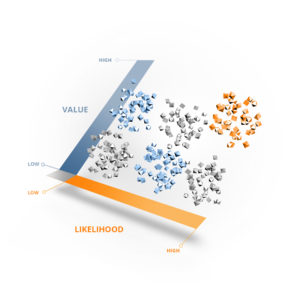
You’ve measured the value of the data by defining your business need. You are on your way to using customer data to help to improve your progress to your end goal. We find out by comparing likelihood to value.
Sam, a director of Admissions at a mid-size university, is in charge of retaining students. He is using data analysis to help understand a drop in retention.
When the analysis is applied to 1,000 student records, it will sort the data against the four factors Sam has selected. It will show which – if any – is causing enrollment to decline.
- The student’s course of study
- Net price
- When they applied
- High school GPA

Figure A
It could be any of these, a combination of factors, or we might find no correlation. Unfortunately, — uncertainty is not a friend to data analytics. Fortunately, you can get help from IMA to assist you in taking these steps with certainty.
Each student is assigned a score on the likelihood they return. This was created by unlocking the unique patterns in data or data mining modeling. The larger the score is, the more likely the outcome. Each dot or mark represents a student, and we can see that some are highly likely to return next year, while others much less so. This can be easily presented in the form of a graph as shown in Figure A.
Value is determined by defining your business need. For Sam, he defined his business need as improving retention without increasing costs. You can use your customer data or student data, in Sam’s case, to help to improve your mission without increasing capacity.
By comparing Likelihood against Value, Sam was able to build strategies and tactics to target the population, improving the rate by 2.5%.
Please read the next blog post to learn more.
